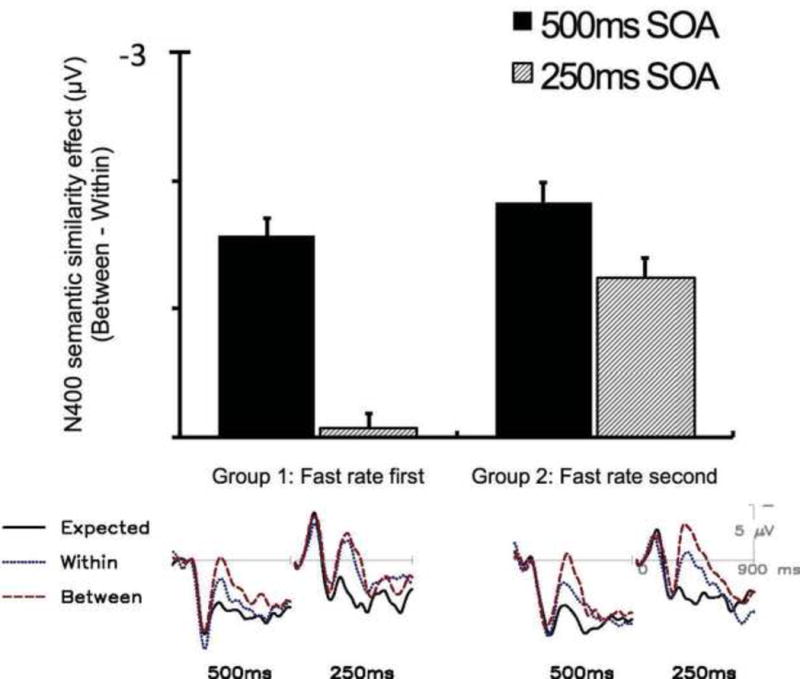
Figure 3.

Mean N400 amplitudes for the semantic similarity effect difference wave (Between category minus Within-category) in the 300–500 ms window post-stimulus onset, for the 250 ms SOA and the 500 ms SOA as a function of SOA block order. ERPs from the right mediolateral parietal site are shown below the bar graph for the two groups in both SOA conditions. Whereas both groups show the semantic similarity effect for the 500 ms SOA, only the group of participants who received the 250 ms SOA block after the 500 ms SOA shows evidence of a semantic similarity effect at the faster presentation rate. Negative is plotted up. Error bars represent standard error of the grand mean.
