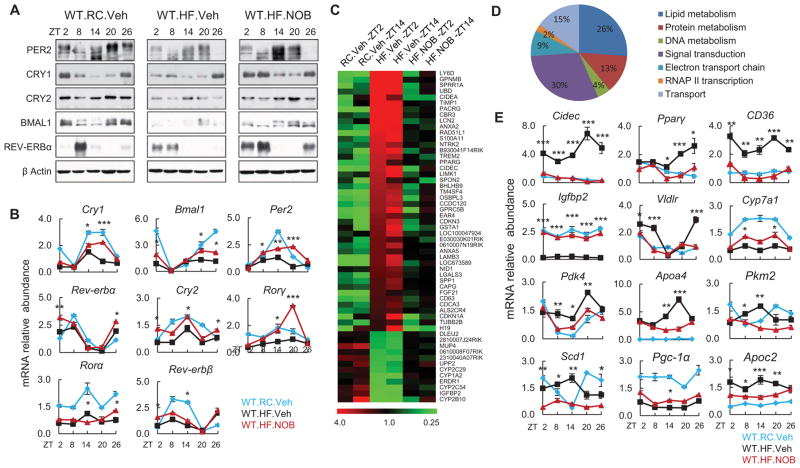
Figure 5. NOB restored circadian oscillation of clock and metabolic output genes in the liver of HFD-fed WT mice.
(A and B) Liver samples were collected from HFD-fed WT mice with vehicle or NOB treatment (WT.HF.Veh and WT.HF.NOB). WT mice fed with regular chow (WT.RC.Veh) were used as controls for comparison (N=3–4). Western blotting (A) and Real-time qPCR (B) analyses were performed to determine protein and mRNA expression of clock genes. (C) Heat map of microarray gene expression data indicating that the expression patterns of 56 genes were altered by HFD, and NOB reversed, to varying degrees, their expression to approximate RC levels in WT mouse liver at both ZT2 and ZT14 time points. Color scale indicates median normalized signal intensity in relative values. (D) Functional classification of 56 genes in (C) by the Gene Ontology (GO) program. Percentages of genes sharing GO biological processes are shown. (E) Real-time qPCR analysis of mRNA expression of clock-controlled metabolic output genes in the livers from treated mice as above. Data are presented as mean ± SEM. *p < 0.05, **p < 0.01, and ***p < 0.001. WT.HF.NOB vs. WT.HF.Veh.

