Figure 4.

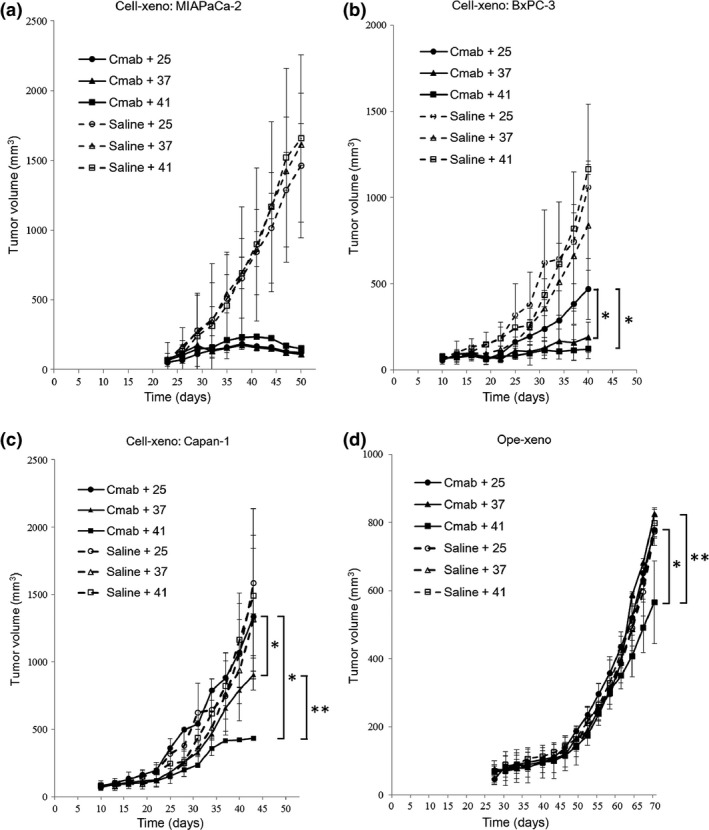
Tumor growth curves in four in vivo pancreatic cancer xenograft mouse models with different stroma amounts treated with cetuximab at different temperatures. (a) Mean MIAPaCa‐2 Cell‐xeno volume at day 50 was not significantly different in the cetuximab (Cmab) + 37°C group (▲, 109 ± 36 mm3) or the 41°C group (■, 151 ± 10 mm3) compared with the 25°C group (●, 123 ± 30 mm3). In the normal saline control groups, the mean tumor volume was not significantly different among the four xenograft models. (b) Mean BxPC‐3 Cell‐xeno volume at day 40 was significantly smaller in the cetuximab + 37°C group (▲, 189 ± 228 mm3) and the 41°C group (■, 121 ± 310 mm3) compared with the 25°C group (●, 470 ± 244 mm3). *P < 0.05, Cmab + 37 group and Cmab + 41 group versus Cmab + 25 group. (c) Mean Capan‐1 Cell‐xeno volume at day 40 was significantly smaller in the cetuximab + 37°C group (▲, 789 ± 36 mm3) and the 41°C group (■, 421 ± 14 mm3) compared with the 25°C group (●, 1070 ± 20 mm3). Furthermore, the mean tumor volumes were significantly smaller in the cetuximab + 41°C group (■, 421 ± 14 mm3) compared with the 37°C group (▲, 789 ± 36 mm3). *P < 0.05, Cmab + 37 group and Cmab + 41 group versus Cmab + 25 group. **P < 0.05, Cmab + 41 group versus Cmab + 37 group. (d) Mean Ope‐xeno volume at day 70 was significantly smaller in the Cetuximab + 41°C group (■, 565 ± 120 mm3) compared with the 37°C group (▲, 823 ± 38 mm3) and the 25°C group (●, 778 ± 38 mm3). *P < 0.05, Cmab + 41 group versus Cmab + 25 group. **P < 0.05, Cmab + 41 group versus Cmab + 37 group.
