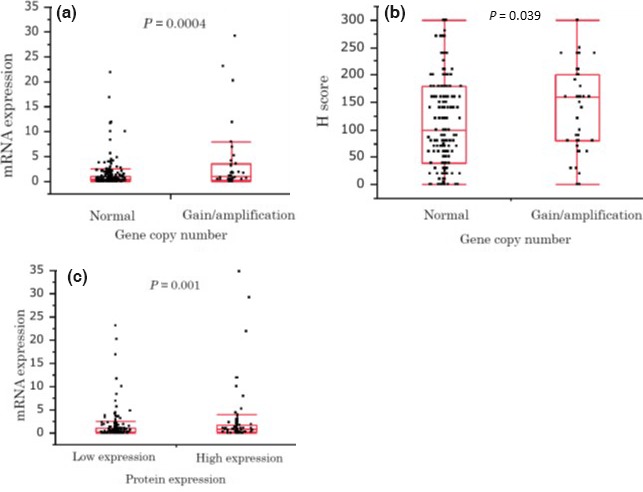
Figure 3.

Correlation between fibroblast growth factor receptor‐1 (FGFR1) amplification, mRNA and protein expression. Relationship between FGFR1 gene copy number and mRNA expression level (a), gene copy number and protein expression level (b), and mRNA and protein expression level (c), verified by the Wilcoxon test. The line within each box represents the median value for that group. Whiskers above and below each box show the maximum and minimum values in that group, respectively.
