
Figure 2.
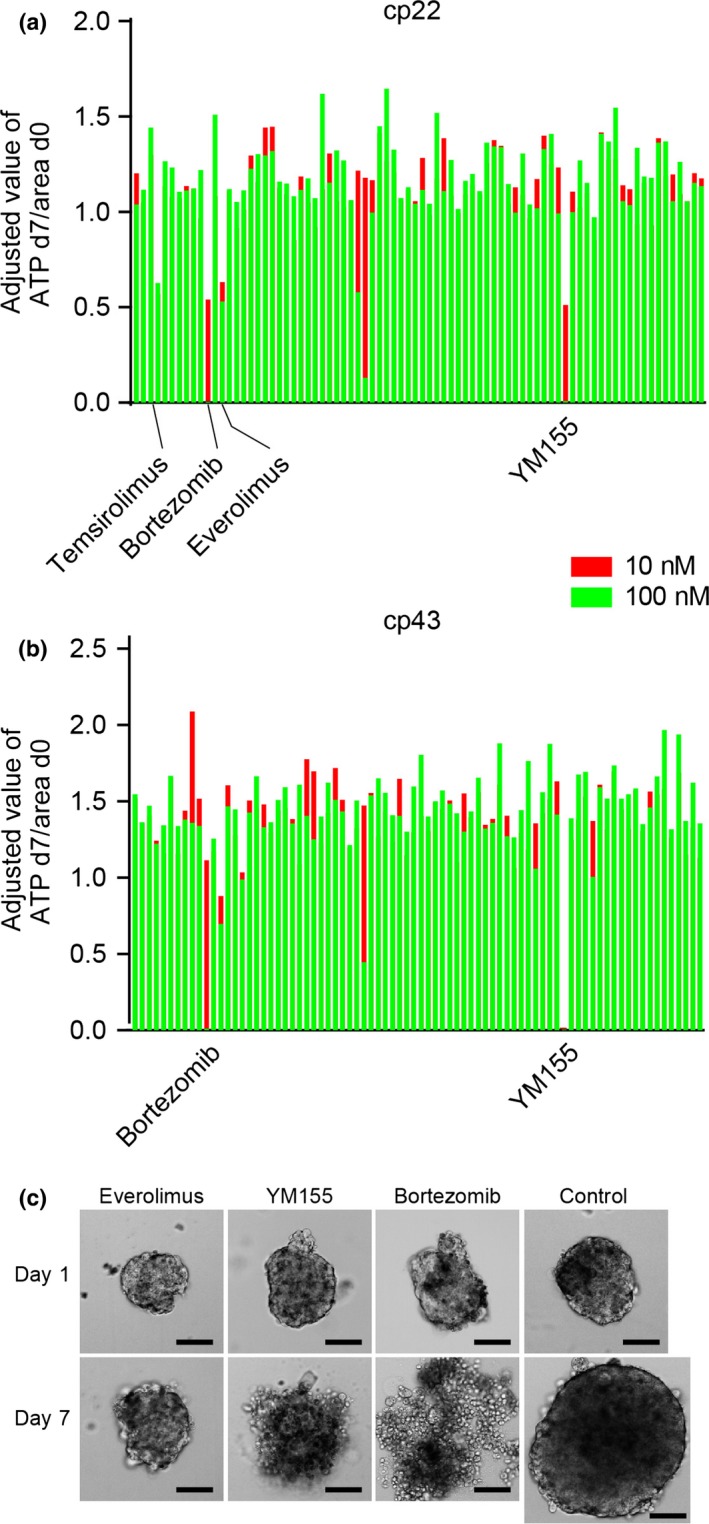
Drug screening using two endometrial cancer tissue‐originated spheroids (CTOS). (a,b) Cp22 (endometrioid adenocarcinoma G3) (a) and cp43 (serous adenocarcinoma) (b) were subjected to a drug screening test using 79 different signaling inhibitors. Each bar indicates an individual drug. Two doses (red bar, 10 nM; green bar, 100 nM) were examined for each drug. Relative ATP values to the control (non‐treated CTOS) at day 7 (d7), adjusted by the area at day 0 (d0), are shown. (c) Phase contrast images of CTOS of cp22 before (day 0) and after 7 days of exposure (day 7) to the indicated drugs. Control is non‐treated CTOS. Scale bar = 100 μm.