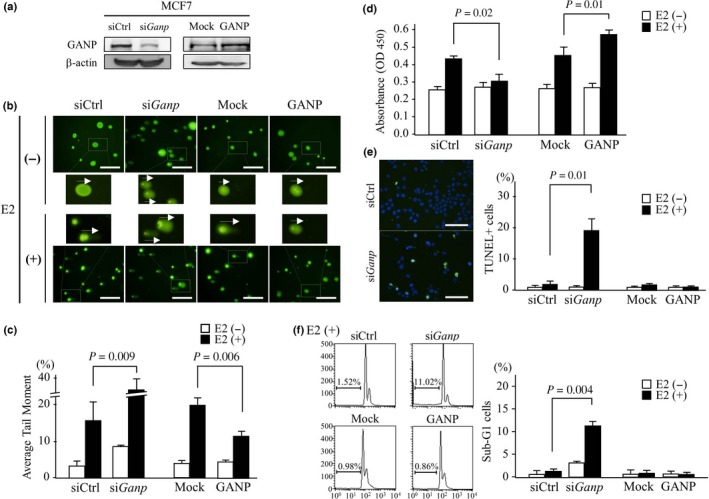
Figure 3.

Effect of ganp‐knockdown or ganp transfection in an E2‐stimulated breast cancer cell line. (A) MCF7 cells were treated with siGanp or control siRNA (siCtrl) and transfected with h‐ganp cDNA (GANP) or a mock control (Mock). GANP expression was detected by Western blot analysis and compared with a β‐actin control. (B,C) E2‐induced DNA damage was measured by the Comet assay. Cells were transfected with siGanp or h‐ganp cDNA and then examined after stimulation with E2 with siCtrl‐treated and mock‐transfected cells used as controls, respectively. The tail of degraded DNA was measured as the tail moment by CometScore. Representative tail lengths are indicated by arrows. Scale bar = 100 μm (B). Error bars represent SD (C). P‐values calculated by Student's t‐test. The data are representative of three independent experiments. (D) Cell proliferation was measured using MTT assay. MCF7 cell treatment was similar to that in (A). Cells were stimulated with E2 for 4 days and then subjected to MTT assay using a Cell Counting Kit‐8. (E) Measurement of apoptotic cells was carried out by the TUNEL assay. MCF7 cells transfected with siGanp or ganp were stimulated with E2 for 4 days then TUNEL positivity per DAPI‐stained cell was counted by fluorescence microscopy. Representative images of E2‐stimulated MCF7 cells are shown (left). Scale bar = 100 μm. (F) Measurement of apoptotic cells with sub‐G1 gating as determined by propidium iodide staining. On day 4 after E2 stimulation, the cells were harvested, stained with propidium iodide solution and analyzed by flow cytometry. Representative cell‐cycle profiles of E2‐stimulated MCF7 cells are shown (left). (D–F) Each column represents the mean and SD. P‐values calculated by Student's t‐test. The experiments were carried out more than three times.
