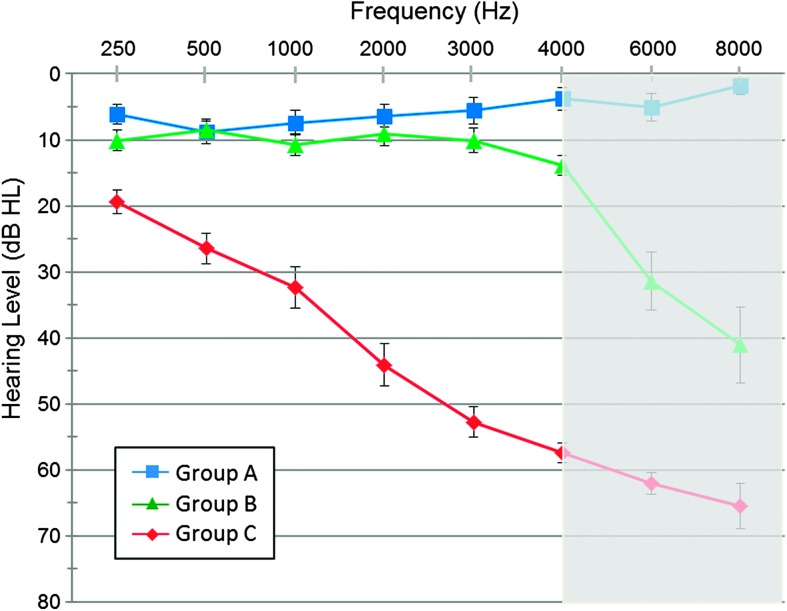
Figure 1.
Mean thresholds for Group A (blue line), Group B (green line), and Group C (red line). Thresholds are displayed for the right ear only. To account for high-frequency threshold differences between Group A and Group B, all stimuli were low-pass filtered at 4000 Hz (depicted by gray shading). Error bars represent the standard errors of the mean.

