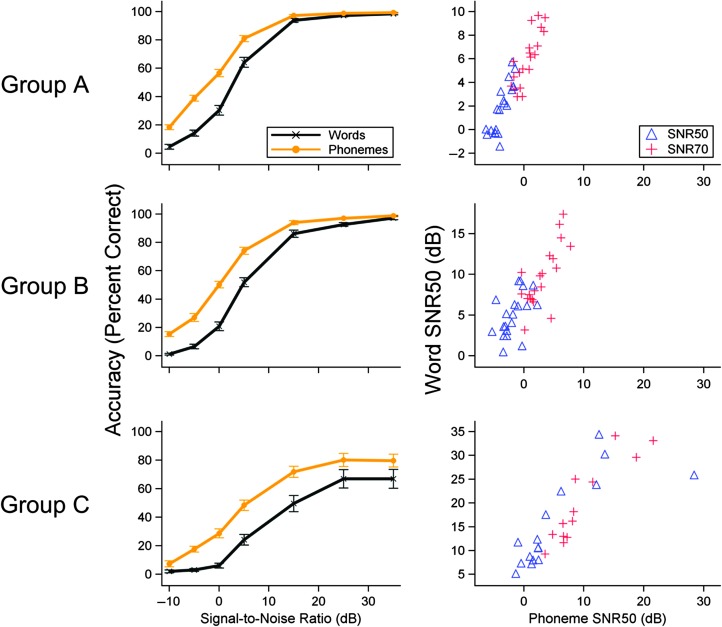
Figure 3.
Word and phoneme psychometric functions (left) and word–phoneme correlations (right) for all three groups for signals presented at 80 dB SPL (error bars represent standard errors of the mean). In general, the overall shape of the function is similar across scoring methods with phoneme scores being 10%–20% better than word scores. Word–phoneme correlations reveal strong relationships between scoring methods.

