
Figure 4.
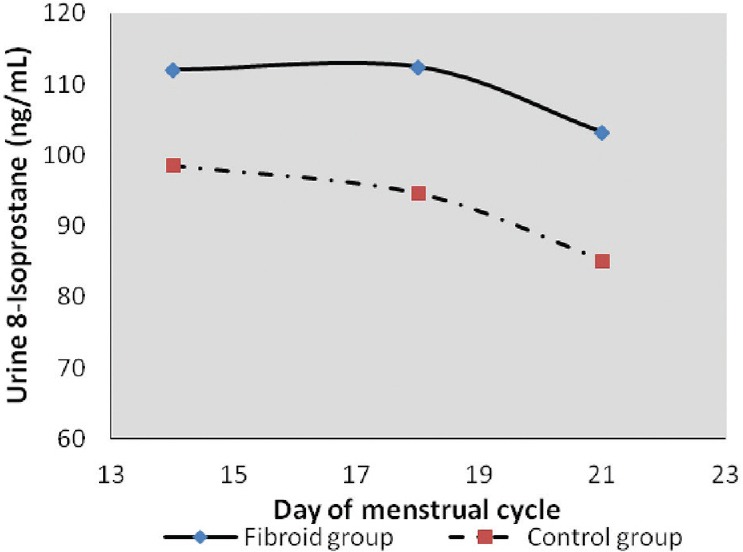
A graph showing urinary 8-isoprostane levels during the ovulatory and luteal phases of the menstrual cycle. Lipid peroxidation patterns were similar in both the control and test groups. Both groups showed a decline from the ovulatory to the luteal phase. However, levels were higher in the test group at all time-points compared to the control group