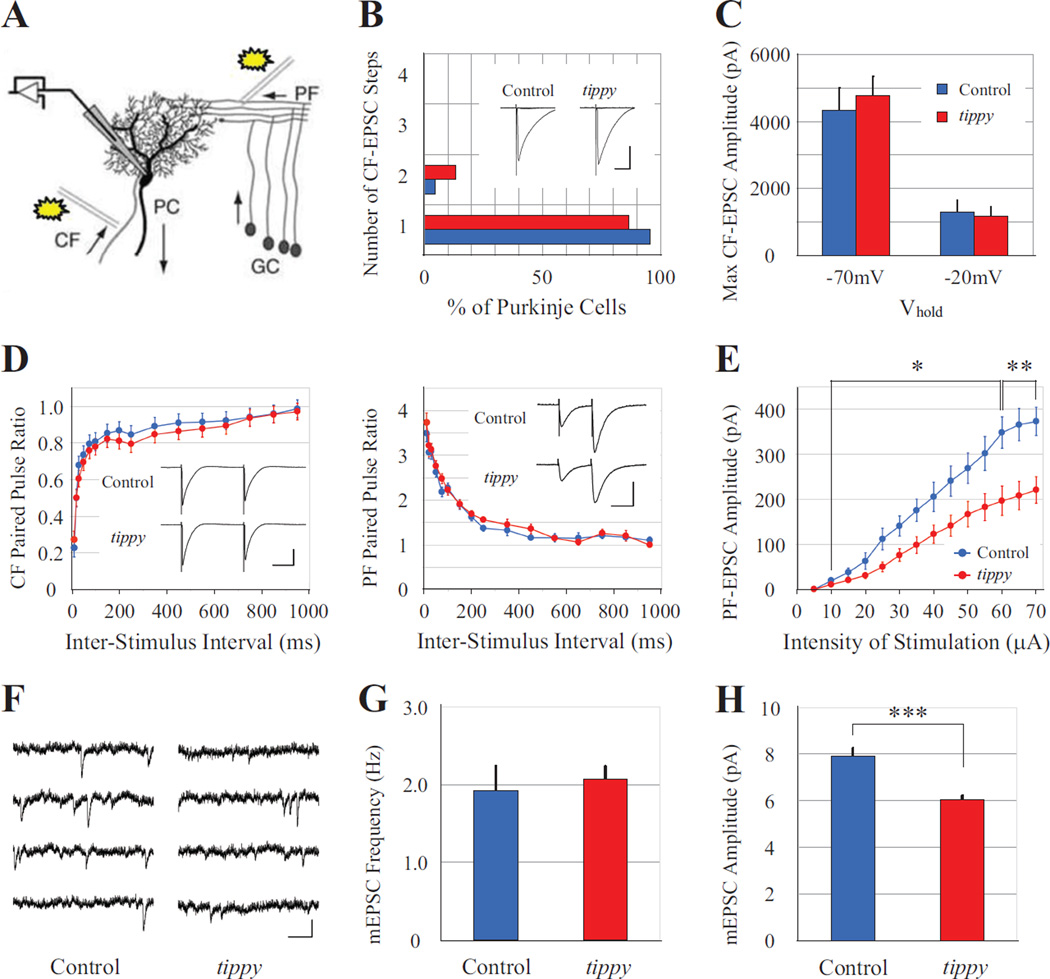
Figure 7. Normal CF-EPSC but reduced PF-EPSC amplitudes in tippy mutant mice.
A, PCs were whole-cell voltage clamped by a patch electrode with stimulation given to parallel fibers (PFs) or climbing fibers (CFs). B,C, Histogram of discrete steps of CF-EPSCs in PCs from control (n = 22 cells, blue) and tippy mutant (n = 15 cells, red) mice at P21–P24 (B) to assess mono- or multiple CF innervation, demonstrated no significant differences between the genotypes. Typical superimposed CF-EPSC traces at −20 mV are shown in the inset. Scale is 20 ms and 500 pA. CF-EPSCs recorded with membrane potentials held at −70 mV or −20 mV (C) indicated no significant difference in the amplitudes between control (n = 7 cells, blue) and mutant (n = 6 cells, red) mice at either potential. D–E, Both CF-EPSCs and PF-EPSCs exhibited normal paired-pulse depression and paired-pulse facilitation (D) in control (blue circles) and tippy mutant (red circles) mice. Typical CF- and PF-EPSC traces are shown in insets. CF-EPSC traces at −20 mV. Scale is 50 ms and 500 pA in CF-EPSCs, and 50 ms and 200 pA in PF-EPSCs, respectively. However, PF-EPSCs elicited from control (n = 13 cells, blue) and tippy mutant (n = 19 cells, red) PCs demonstrated significantly decreased amplitudes in mutants in response to increasing stimulus intensities (E). mEPSCS were recorded from PCs under the bath application of TTX. F, Representative recordings from control (n = 17 cells) and tippy mutant (n = 21 cells) cerebella are shown. Scale is 250 ms and 10 pA. G, No significant difference was observed in the frequency of mEPSCs between control and mutant mice. H, However, tippy mutant mice exhibited significantly reduced mEPSC amplitudes compared to controls. Data are expressed as mean ± SEM. *p < 0.05; **p < 0.005; ***p < 0.0001, Student’s t-test.

