
Figure 2.
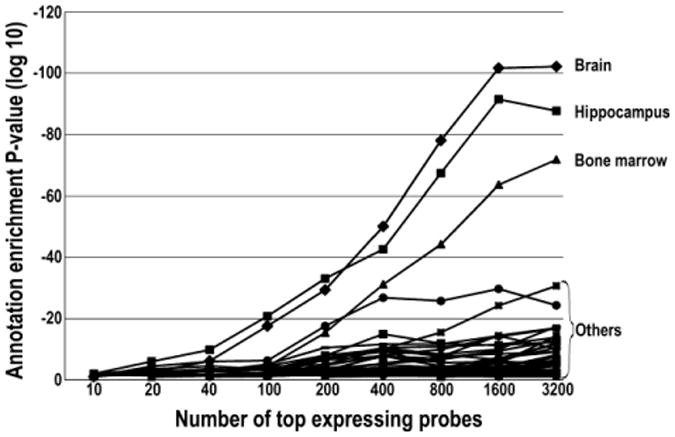
Transcriptomic tissue annotation profile from increasing numbers of top expressing probes showing the ranking of tissue annotation for the top expressing probes at increasing depth.
Official websites use .gov
A
.gov website belongs to an official
government organization in the United States.
Secure .gov websites use HTTPS
A lock (
) or https:// means you've safely
connected to the .gov website. Share sensitive
information only on official, secure websites.
Transcriptomic tissue annotation profile from increasing numbers of top expressing probes showing the ranking of tissue annotation for the top expressing probes at increasing depth.