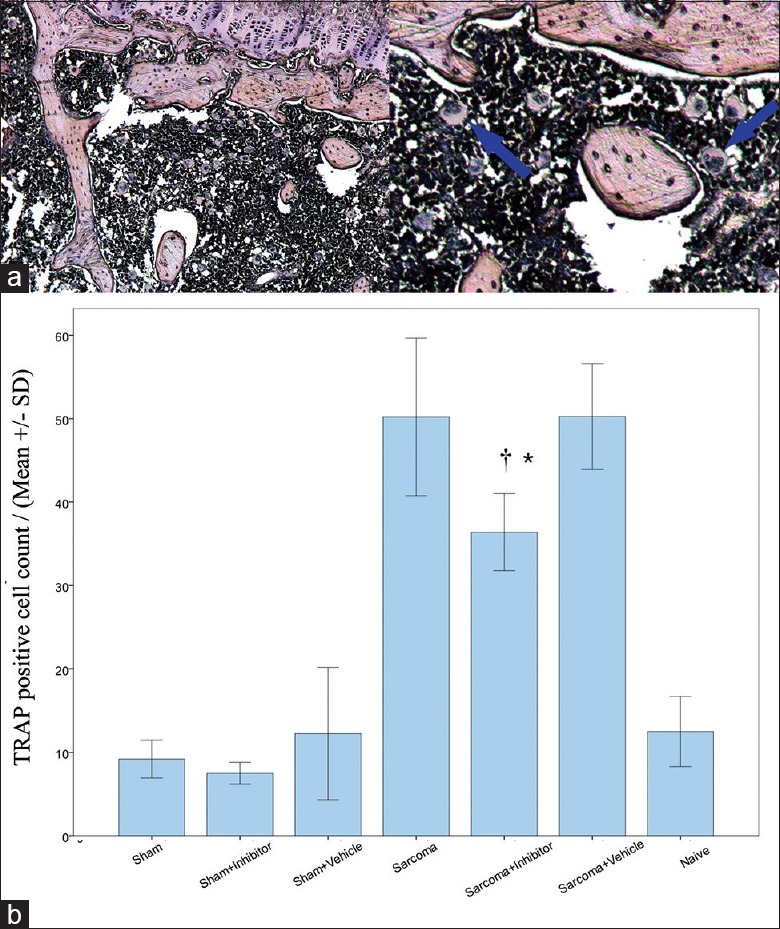
Figure 3.

(a) Tartrate-resistant acid phosphatase (TRAP) stain of matured osteoclasts in tumor bone site (left: Original magnification, ×100, right: Original magnification, ×200); (b) TRAP positive cell count in tumor injected tibia bone of each group. *P < 0.05 for sarcoma + inhibitor versus naïve. †P < 0.05 for sarcoma + inhibitor versus sarcoma + vehicle.
