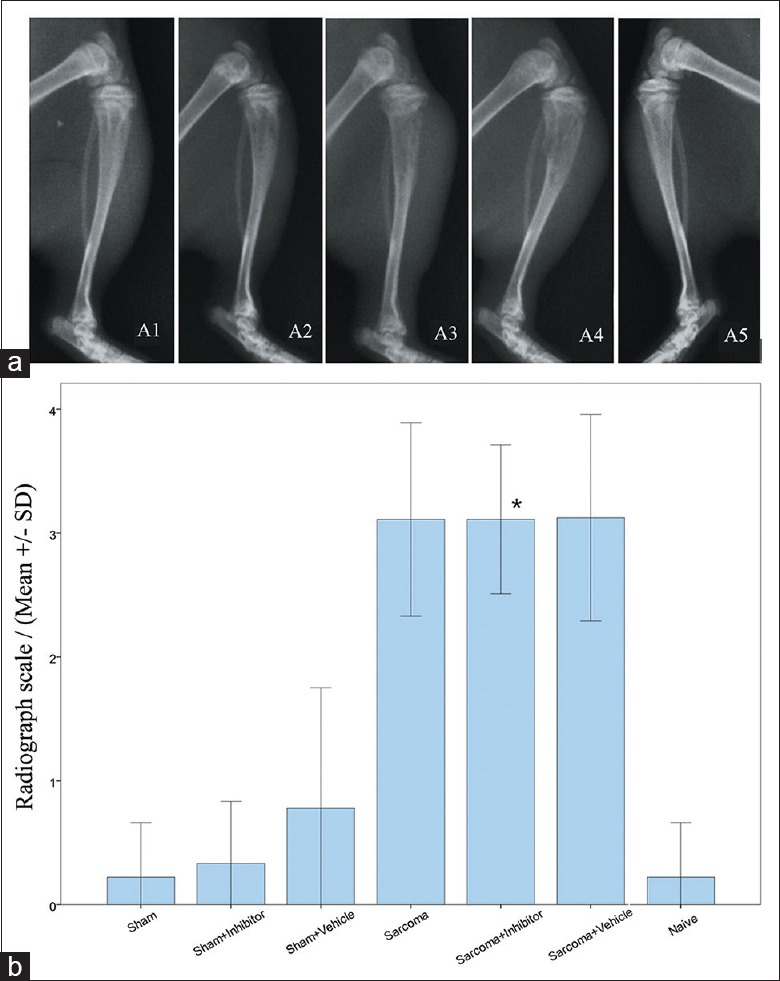
Figure 4.

Radiographs and radiology scale of surgical side tibia of each group. (a) Radiographs of different levels of bone destruction. A1: Normal bone; A2: Spotted bone resorption sites; A3: Loss of bone in medullary canal with destruction of distal cortical bone; A4: Total destruction and discontinuity of cortical bone; A5: Non-surgical side hind paw; (b) Radiology scale of surgical side hind paws. *P < 0.05 for sarcoma + inhibitor versus naïve group.
