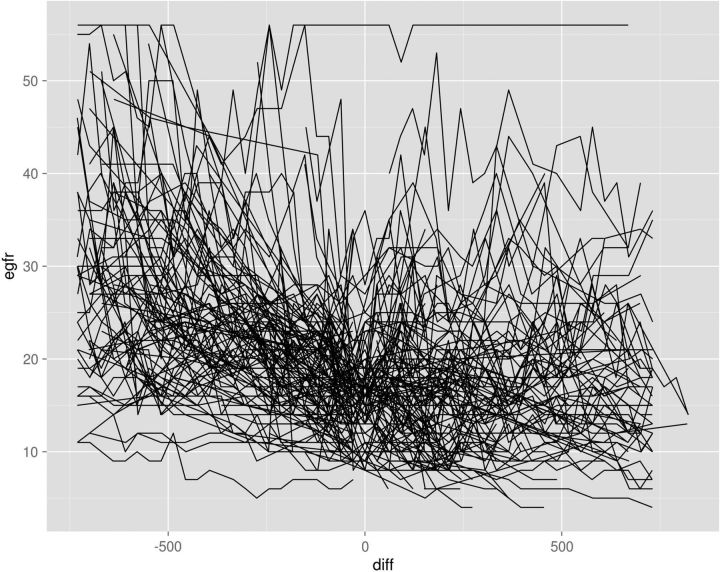
FIGURE 1:
The eGFR curves of all 123 successfully created AV fistula patients. The eGFR is plotted on the vertical axis, time in days on the horizontal axis. Zero on the horizontal axis is the time point for AVF creation, with eGFR values to the left of zero representing the days before the access creation and to the right of zero the days after creation. Patient 17 had an AVF created for recurrent plasma exchanges with thrombotic thrombocytopenic purpura and the eGFR was unchanged (>50 mL/min) over the course of the observation period.

