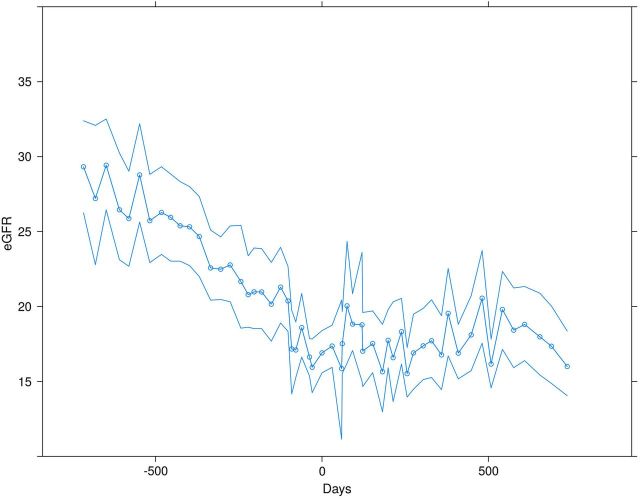
FIGURE 2:
The eGFR trajectory prior to AVF creation, where zero is the time of fistula creation, and after AVF creation (mean and bootstrapped 95% confidence intervals). Prior to AVF formation, the rate of change was −5.90 mL/min/year (95% CI −5.28, −6.51), while after AVF formation the rate of change was −0.46 mL/min/year (95% CI −1.05, 0.14) (interaction P < 0.001).

