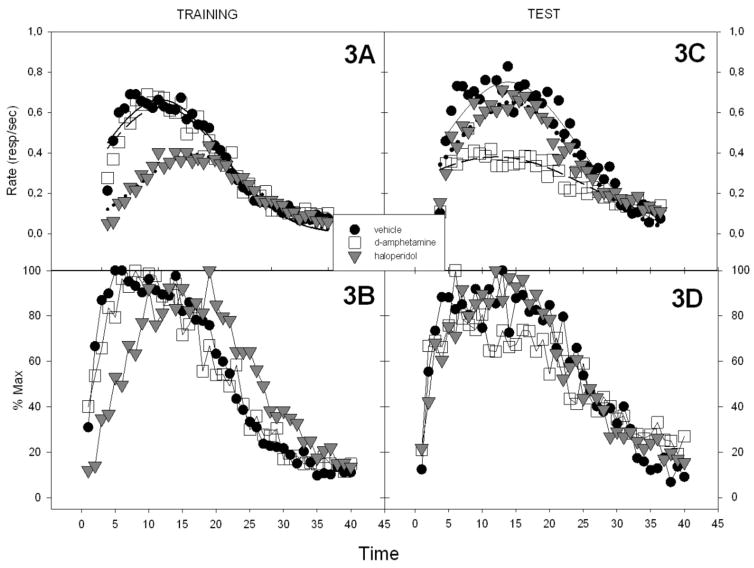
Figure 3.
The training, test fittings and relative rates for all groups. All the fits were performed with a three-parameter Gaussian equation (f=a*exp(−.5*((x−x0)/b)^2)). 3A) Gaussian fits to the training data for all groups. 3B) The relative response rates (% of the maximum response) in the training conditions. 3C) The Gaussian fits to the test data for all groups. 3D) The relative response rates for the the test sessions (% of the maximum response).

