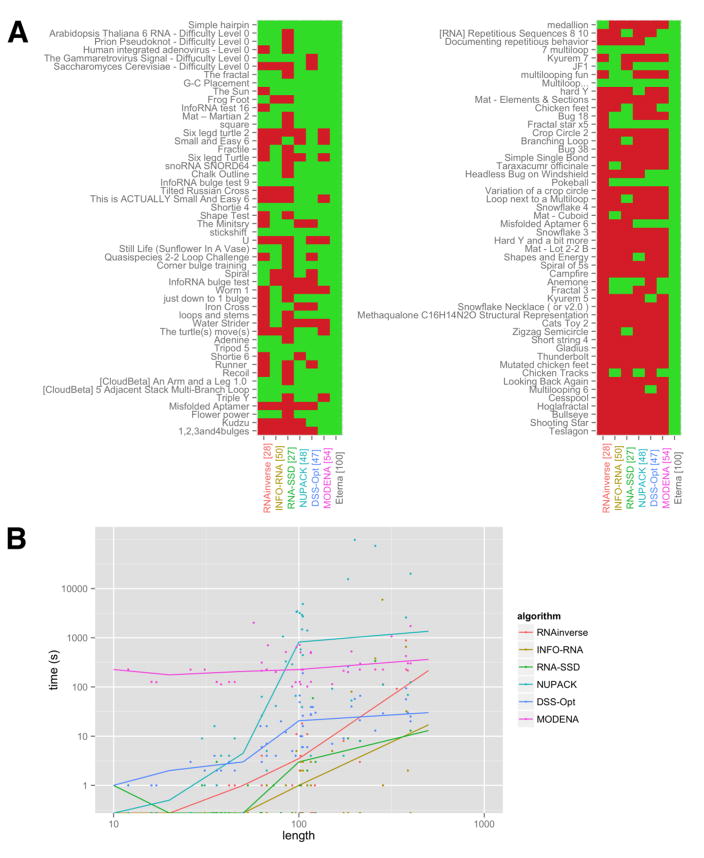
Figure 5. Performance of existing algorithms on the Eterna100 benchmark.
Six RNA design algorithms were evaluated using the Eterna100 benchmark. [A] The successes (green) and failures (red) are shown for each algorithm. The puzzles are ordered by the number of successful solvers on Eterna, from fewest to most, and the algorithms are labeled with the number of puzzles solved. [B] The amount of time required to reach a solution for puzzles of different lengths is shown for each algorithm. Lines show the median values over each bin of lengths.

