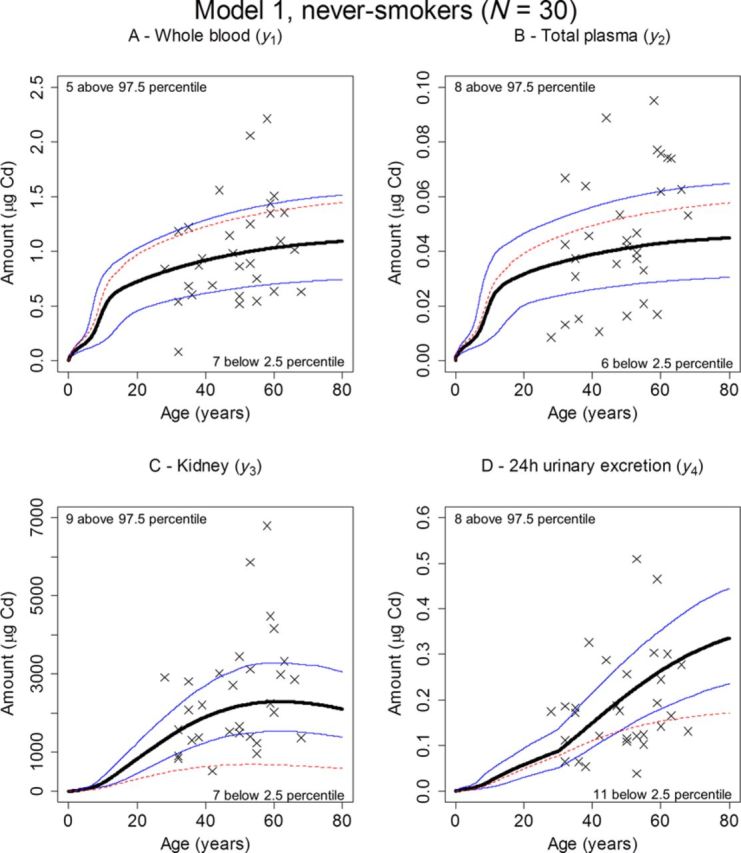
FIG. 6.

Predicted (median, thick, solid; 2.5 percentile, lower thin, solid; 97.5 percentile, upper thin, solid) versus observed amounts (×) of Cd in whole blood (A), total plasma (B), kidney (C), and 24-h urine (D). The percentiles were obtained by Monte Carlo simulation using randomly drawn demographic data from the 30 never-smoking kidney donors and posterior distributions obtained in the MCMC analysis with Model 1. Also shown are the corresponding predicted amounts (median, thin, dashed) when all parameters were kept fixed to their original K&N values in the MCMC analysis, and only the posterior for the daily systemic uptake, IBW, was estimated. The number of observations falling above the 97.5 percentiles or below the 2.5 percentiles is also indicated.
