Fig. 1.
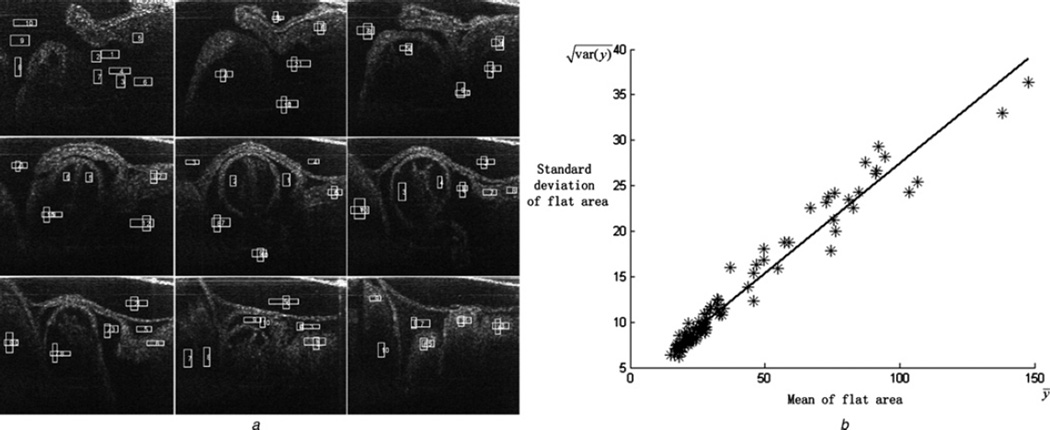
Flat ROIs in nine OCT heart tube images and the relationship between their corresponding mean and standard deviation
a Flat regions selected from nine OCT heart tube images
b Mean and standard deviation of the selected regions
The mean and standard deviation fit a linear relationship, as shown in Fig. 1b

