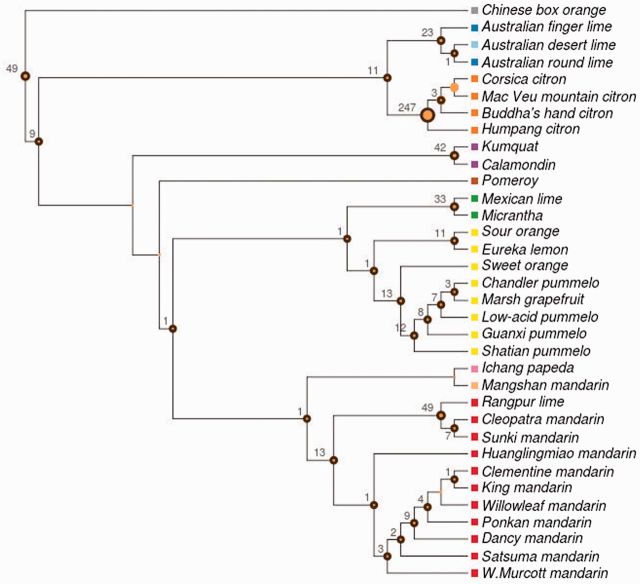
Fig. 4.
Ancestral inference of heteroplasmic events per node. Node size is proportional to the amount of heteroplasmic events occurred on each corresponding node. Colors represent the main chloroplast groups as indicated for figure 3. Circles with black border indicate hypothetical origins of heteroplasmic events.

