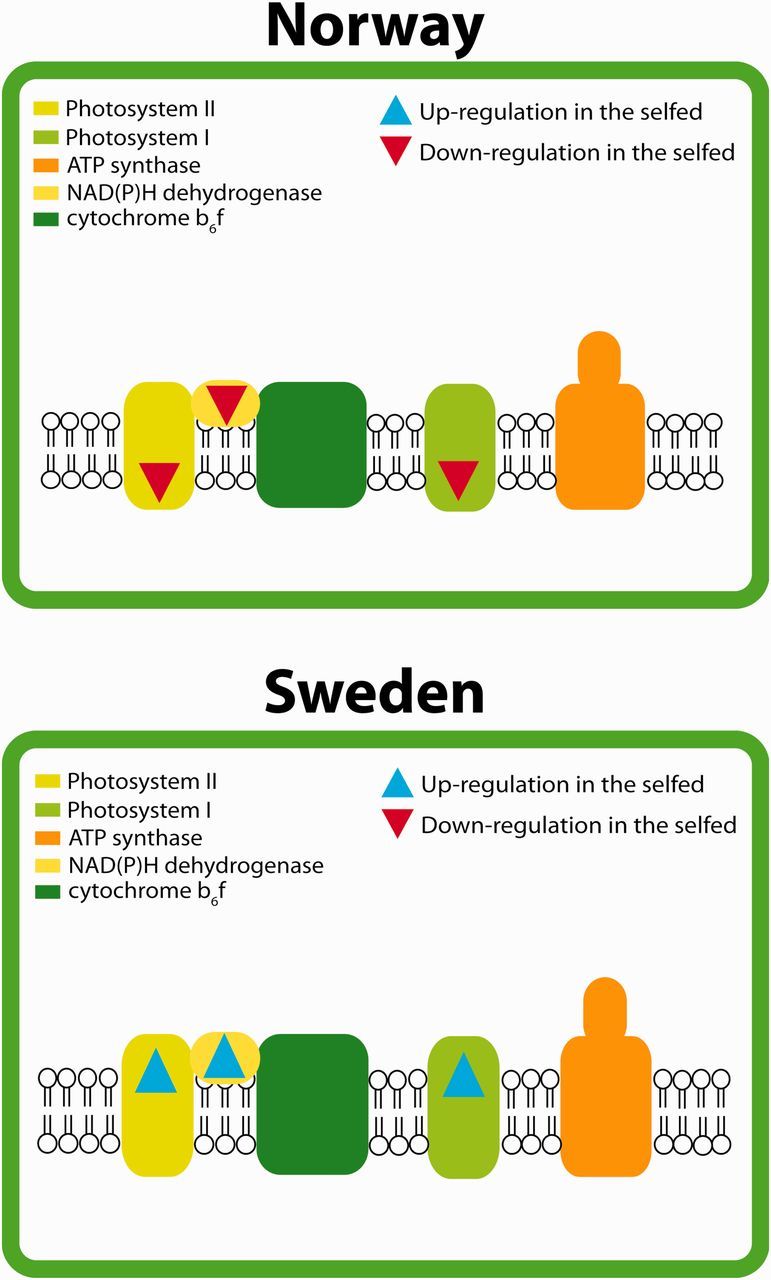
Fig. 6.

Results from chloroplast pathway analyses in the (A) Norwegian and (B) Swedish population, respectively. The analyses were based on genes that were significantly differentially expressed in both populations. Assignment of genes into pathways was achieved by ortholog Markov clustering against Arabidopsis thaliana and mapping of orthologs into pathways. Blue signifies a positive log2 fold change in the selfed compared with the outcrossed (upregulation), whereas red signifies a negative log2 fold change in the selfed compared with the outcrossed (downregulation).
