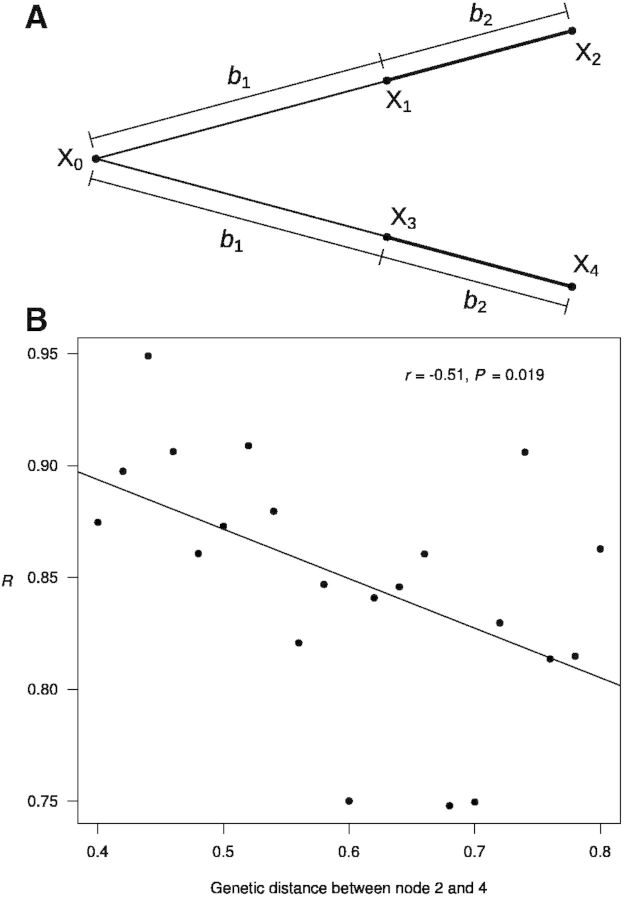
Fig. 4.
Simulation of protein sequence evolution with changing equilibrium amino acid frequencies at each site. (A) The tree used in the simulation. Molecular convergence is examined for the two thick branches. Amino acids at nodes 0–4 are indicated by X0–X4, respectively. The branch lengths are indicated by the b values. (B) The number of observed molecular convergences relative to the expected (R) decreases with the genetic distance between nodes 2 and 4. Each dot represents a simulation of 500,000 sites. For different dots, b1 varies but b2 is the same.

