Fig. 5.
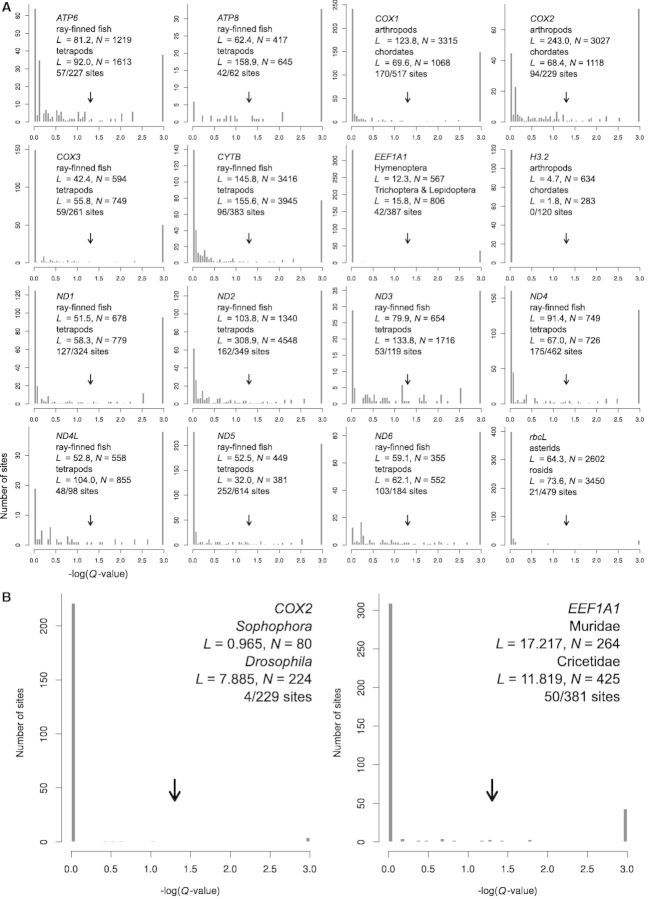
Site-specific differences in acceptable amino acids between different clades of organisms. (A) Frequency distribution of −log10(Q value) measuring the significance of difference in acceptable amino acids at a site between two distantly related large clades. Arrows correspond to Q value = 0.05. For each plot, the name, total branch lengths (L), and number of species (N) of each of the two clades compared are indicated. The number of sites with Q value < 0.05 is indicated, followed by the total number of sites examined. (B) Frequency distribution of −log10(Q value) measuring the significance of difference in acceptable amino acids at a site between two closely related clades.

