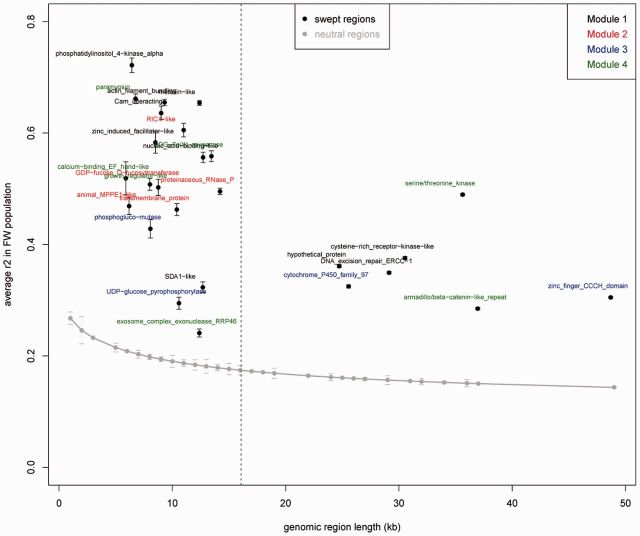
Fig. 5.
Selection strength on genes of different regulatory modules, evaluated using sweep length and level of LD. Selection strength was evaluated using the length (x axis) and the average LD (r2 measure) of each sweep window in the FW population. The vertical dashed line indicates the average sweep length (∼16 kb). Gray dots and associated bars indicate the genome-wide average and standard error of the average r2 value for different lengths of genomic region (the same sizes as the swept regions). Black dots and associated bars indicate the average, and standard error of the average value of r2 in each swept region. The color code pinpoints genes of the four different modules of coregulated swept genes identified by hierarchical clustering of expression data (fig. 4).

