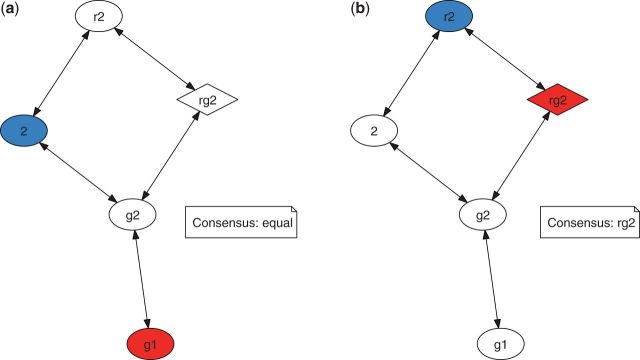
Fig. 1.
Graphs representing the forward (red) and backward (blue) hLRT tests. Each node represents a model configuration according to table 2. End nodes are colored accordingly. Diamond-shaped nodes are AICc test favorite configurations. (a) refers to the first MSA in the L90p50 data set (length: 2,055 nt), whereas (b) depicts the model selection in the first MSA of the L60p30 data set (length: 45,099 nt).

