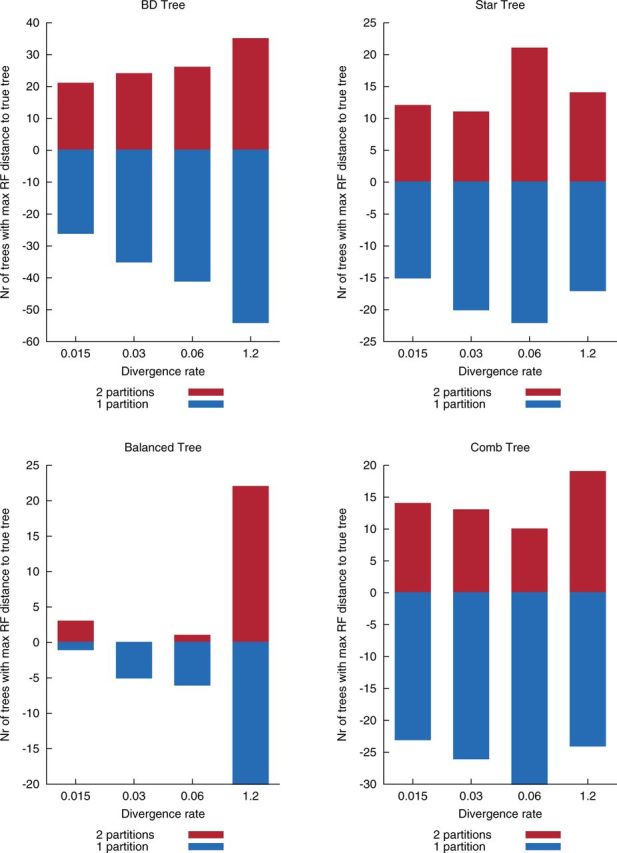
Fig. 3.

Results on simulated data with different divergence rates and different guide trees. “BD Tree” refers to simulated topologies according to a birth–death process (100 simulations; see Materials and Methods); “Comb tree” (50 simulations), “Balanced tree” (50 simulations), and “Star tree” (100 simulations) refer to well-known artificial topologies. We measure the Robinson–Foulds distance of the estimated trees under a one-partition (blue) or two-partition (red) model to the true tree of the simulation. Displayed are the counts on how many times a certain configuration was further from the true tree than its competitor (smaller bars are better; the sign of the bar is arbitrary).
