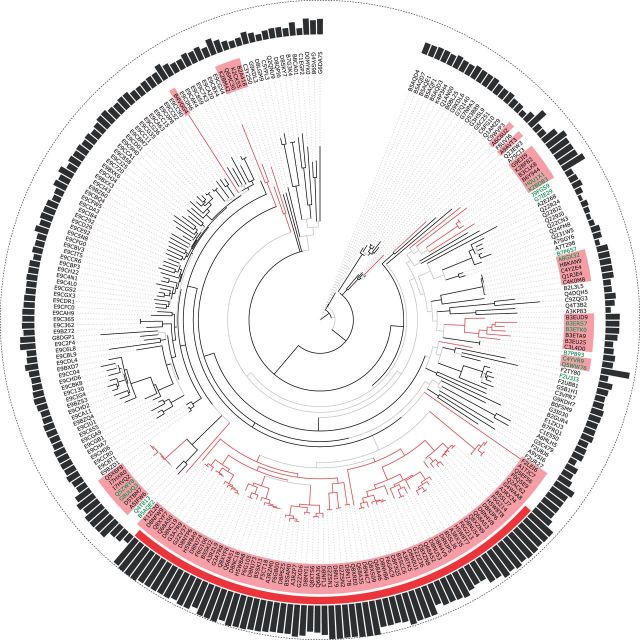
Fig. 4.
Phylogenetic tree of the first MSA in L60p30 after pruning of the MSA. Bacterial sequences are marked as red; the red ribbon spans the sequences of Ralstonia. HMM scores are shown as black bars; branches with aBayes support lower than 0.9 are held in gray. Labels that also occur in table 4 are written in green.

