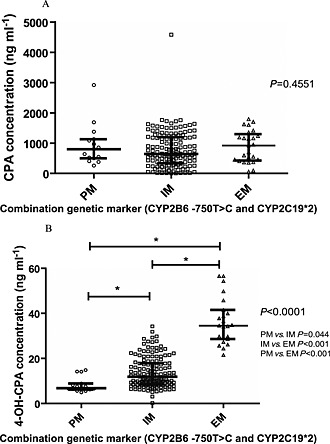
Figure 2.

Scatterplots depicting the plasma concentration of cyclophosphamide (CPA) and 4‐hydroxycyclophosphamide (4‐OH‐CPA) classified by the combination genetic marker of CYP2C19*2 and CYP2B6 ‐750 T > C. (A) Scatter plot of CPA concentration grouped by genetic markers. (B) Scatter plot of 4‐OH‐CPA concentration grouped by genetic markers. Each dot represents the concentration data of one patient and the median value in each genotype is shown with a bar. The P values of Kruskal–Wallis H test are listed at the right of each plot. Extensive metabolizer (EM) was defined as CYP2C19*1*1 and CYP2B6 ‐750TT genotype while poor metabolizer (PM) was defined as CYP2C19*2*2 and CYP2B6 ‐750CC genotype. Patients with mixed genotypes at these two loci were defined as intermediate metabolizers (IM)* P < 0.05 (Dunn's multiple comparison tests between two groups).
