
Figure 3.
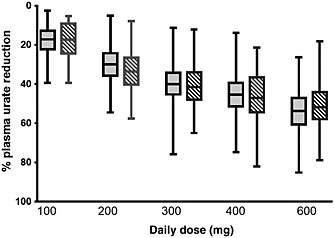
A comparison of the percent reduction in plasma urate from baseline under different allopurinol daily doses using PKPD model predictions (dark shaded, left) and external data extracted from the published literature 46, 47, 48, 49 (hatched, right). Boxes represent the quartiles (centre line is the median) of the data while the whiskers extend to include all data