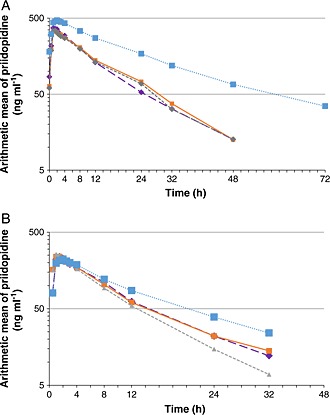
Figure 1.

Semilogarithmic plots of the plasma concentrations of pridopidine after single and multiple dose administrations to healthy and renally‐impaired subjects.  normal matched to mild renal impairment,
  normal matched to moderate renal impairment,
  mild renal impairment,
  moderate renal impairment
