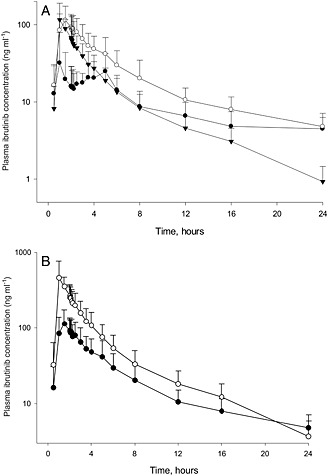
Figure 2.

The mean plasma concentration‐time profiles of ibrutinib following (n=8) A. Oral administration of 560 mg ibrutinib under fasted (  Treatment A) and fed (
  Treatment B) conditions, and 140 mg ibrutinib under fed condition with grapefruit juice (
  Treatment C). B. Ibrutinib following oral administration of 560 mg ibrutinib without grapefruit juice (
  Treatment B) and dose‐normalized ibrutinib with grapefruit juice (
  Treatment C).
