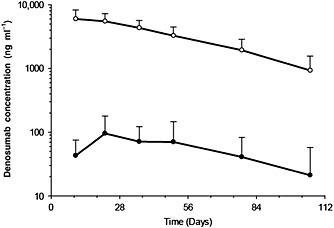
Figure 2.

Serum and seminal fluid denosumab concentration–time profiles following a single subcutaneo us administration of denosumab 60 mg to healthy male volunteers. Data are means and standard deviations.  , Serum (N = 11–12);
  , Semen (N = 11–12).
