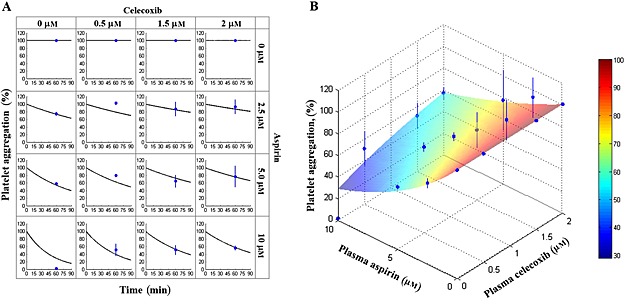
Figure 2.

Aspirin‐celecoxib observed vs. predicted data. Samples of platelet‐rich plasma from healthy volunteers were incubated for 60 min with different concentrations of aspirin or/and celecoxib. Arachidonic acid was added and platelet aggregation was measured. The observed values are shown as blue dots and lines (average ± SD of four studies), and modelling‐based predictions for studied aspirin and celecoxib concentrations (A, black lines) and for the wide range of aspirin and celecoxib concentrations (B, color‐coded surface) are shown
