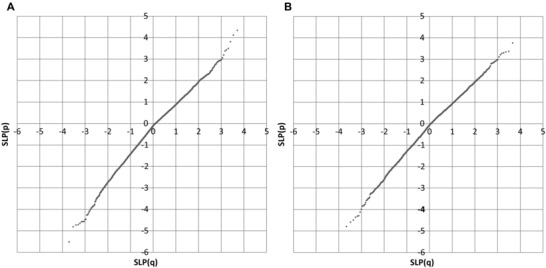
Figure 1.

Q:Q plots for SLP obtained from SCOREASSOC compared to expected under null hypothesis. Positive SLPs indicate an excess of rare, functional variants in SZ subjects, negative SLPs indicate an excess in OB subjects. (A) Shows results using broad category of variants, (B) for narrow category.
