
Figure 4.
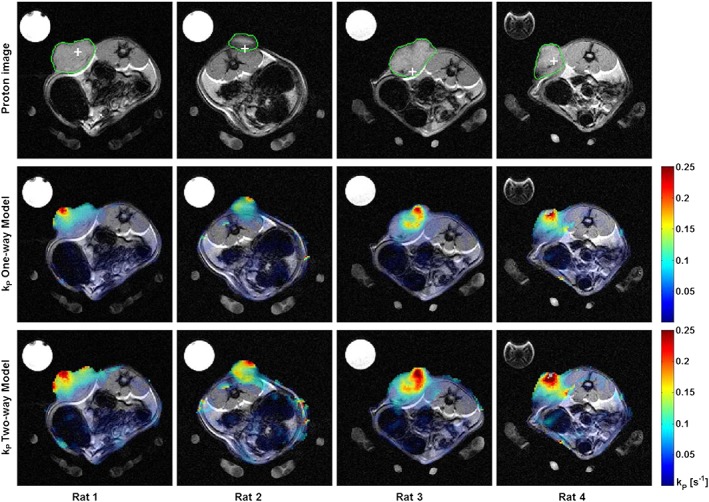
Functional parameter mapping in four rats with subcutaneous mammary adenocarcinomas demonstrating intratumoral heterogeneity. (a) Grey scale anatomical proton images showing the outline of the implanted tumours defining the ROI (green) and POI (white cross) used for modelling. (b) False‐colour functional maps of k P calculated using the one‐way integral model superimposed over the grey scale anatomical imaging. (c) Similar colour maps using a two‐way integral model. The maximum k P has been limited to 0.25 s−1 in both cases.