
Figure 3.
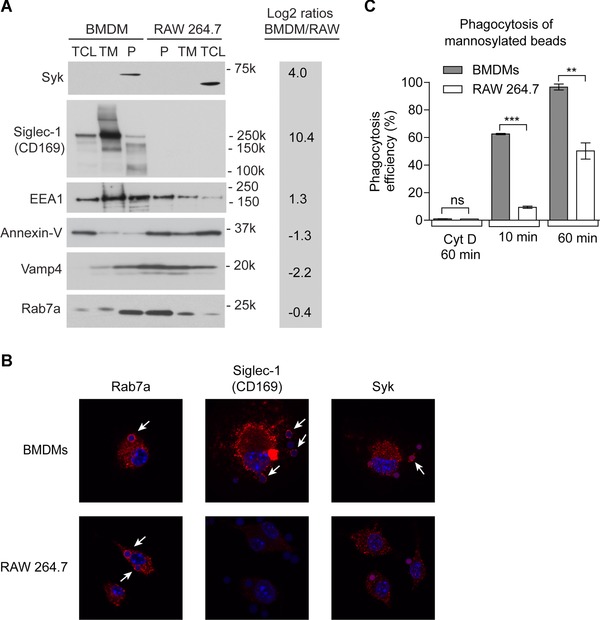
Validation of the proteomics results. (A) Western blotting analysis of six proteins selected from the proteomics data. P, phagosome; TM, total membrane extract; TCL, total cell lysate. Log2 ratios of proteomics results are given for convenience. (B) Fluorescence microscopy of Rab7a, Siglec‐1, and Syk proteins showed much stronger expression of Siglec‐1 in BMDMs than RAW 264.7 cells. Rab7a was localized to the phagosome in both cell types but Siglec‐1 and Syk were only associated with the phagosome in BMDMs. (C) The efficiency of phagocytosis of mannan‐coated beads is strongly increased in BMDMs compared to RAW 264.7 cells, due to the much higher expression of mannose receptor 1 (MRC1). Error bars represent standard deviation, pair‐wise t‐test comparison with ***p < 0.0001 and **p < 0.001.