
Figure 3.
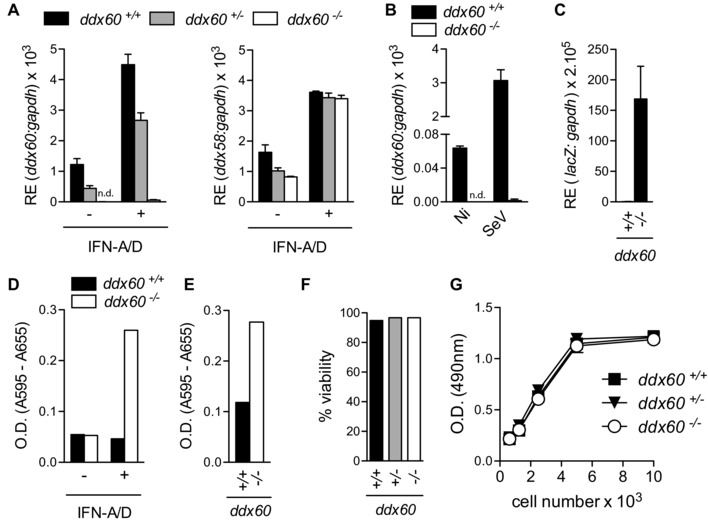
Validation of Ddx60 KO mouse. (A) Expression Ddx60 and Ddx58 (rig‐i) from Ddx60+/+, Ddx60+/−, and Ddx60−/− MEFs treated (+) or not (−) with recombinant IFN‐A/D (16 h, 1000 IU/mL) (B) Expression of Ddx60 from Ddx60+/+ and Ddx60−/− BMMCs infected with SeV (multiplicity of infection 20) for 6 h. (C) Expression lacZ mRNA from large‐T antigen transformed Ddx60+/+ or Ddx60−/− MEFs treated with IFN‐A/D (16 h, 1000 IU/mL). (D) β‐Galactosidase activity from 1 × 10⁶ LT‐transformed Ddx60+/+ or Ddx60−/− MEFs treated (+) or not (−) with recombinant IFN‐A/D (1000 IU/mL; 16 h). (E) β‐Galactosidase activity from 1 × 10⁶ total splenocytes from Ddx60+/+ or Ddx60−/− mice treated overnight with poly(I:C) (i.p., 200 μg/mouse). (F) Data from Trypan blue exclusion assay from MEFs. Data represents the average from at least two different embryos per genotype. (G) Indicated numbers of MEFs were plated and cell proliferation was assessed 5 days later. Each data point represents the mean of eight wells. (n.d.: not detected). For PCR data, the mean (±SD) of triplicate technical replicates is shown. For all experiments one representative of three independent experimental repeats is shown.