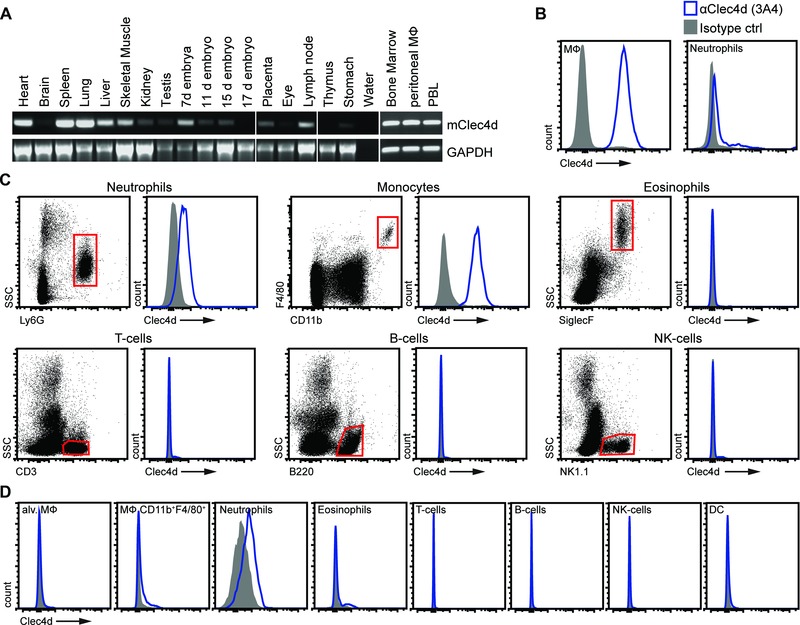
Figure 2.

Clec4d is expressed on myeloid cells. (A) RT‐PCR analysis of Clec4d expression in cells and tissues, as indicated. GAPDH served as a housekeeping control. Data from a single experiment. (B–D) Representative flow cytometry plots of Clec4d protein expression on (B) resident peritoneal cells, (C) PBL, and (D) lung. (C) An example of the gating strategies used is shown for PBL. Gray filled histograms show IgG1‐stained cells while open blue histograms show Clec4d (3A4) stained cells. (B–D) Data shown are representative of at least three animals representative of at least two experiments performed.
