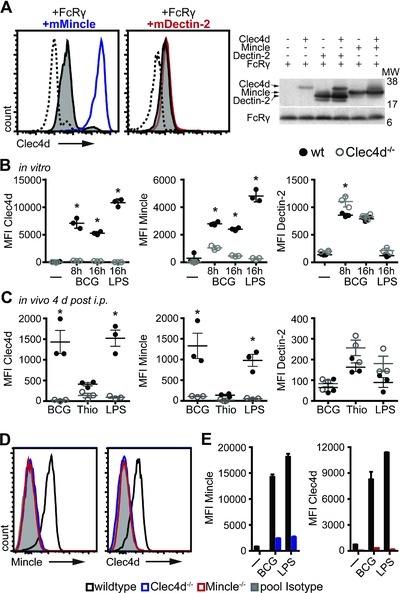
Figure 4.

Clec4d forms a complex with Mincle, but not Dectin‐2. (A) NIH‐3T3 fibroblast cells were transduced with FcRγ, Clec4d, and Mincle or Dectin2, as indicated, followed by flow cytometric analysis of Clec4d surface expression (left). Representative histograms of four independent experiments performed on individual samples are shown: dotted histograms, FcRγ alone; gray filled histograms, FcRγ with Clec4d; blue and red histograms, Clec4d expression in the presence of Mincle and Dectin‐2, respectively. Receptor protein expression was confirmed by Western blot using 25 μg of RIPA cell lysates probed with anti‐HA or anti‐FcRγ followed by peroxidase conjugated anti‐mouse or anti‐rabbit, respectively (right). (B) Thioglycollate elicited macrophages from wild type or Clec4d−/− mice (n = 3) were stimulated as indicated and Clec4d (3A4), Mincle (4A9), and Dectin‐2 (11E4) expression assessed by flow cytometry and represented as MFI. (C) Wild type or Clec4d−/− mice (n = 3) were injected with immunomodulators intraperitoneally and cells harvested 4 days later by peritoneal lavage followed by flow cytometric analysis of CTLR expression. (B, C) Each symbol represents an individual mouse and bars represent mean + SEM of single experiments representative of one (B) or two (C) experiments performed. Statistical significance was determined by ANOVA and Dunnett's multiple‐comparison posttests, *p < 0.05. (D) PBL from naïve wild‐type (black histograms), Clec4d−/− (blue histograms), and Mincle−/− (red histograms) mice were analyzed for receptor expression by flow cytometry. Histograms represent Clec4d (3A4) and Mincle (4A9) expression on Ly6G+ PMNs compared to IgG1 isotype staining (gray filled histograms). Data shown are from a single experiment. (E) BMM from wild type (black bars), Clec4d−/− (blue bars) or Mincle−/− mice (red bars) were left untreated or treated with M. bovis BCG or LPS for 16 h and receptor expression assessed by flow cytometry. Data are shown as mean + SD from a single experiment performed in duplicates.
