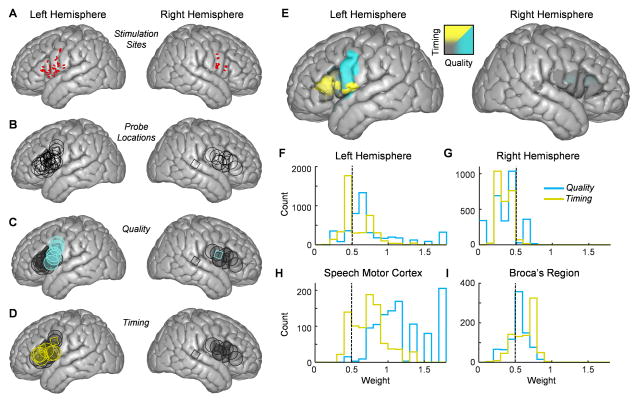
Figure 3. Functional speech maps as determined by electrical stimulation and focal cooling.
(A) Electrical stimulation mapping sites (represented by red ovals) that resulted in speech arrest for left (30 sites in 11 subjects) and right (12 sites in 4 subjects) hemispheres plotted on an ICBM template brain.
(B) Template brains on the left and right hemispheres displaying the cooling probe locations across all subjects on the left (30 sites in 12 subjects) and right (12 sites in 4 subjects) hemispheres.
(C and D) Cooling sites were designated to result in either a significant change in speech quality (C) or timing (D), indicated by blue or yellow shapes respectively. Sites that were significant for both timing and quality were designated as the category with the larger effect.
(E) A functional map showing behavioral results for both hemispheres.
(F and G) Histograms of all pixel values from speech areas on left (F) and right (G) hemispheres showing values for quality (blue) and timing (yellow).
(H and I) The distribution of timing and quality values for pixels in the speech motor cortex (H) and Broca’s region (I).

