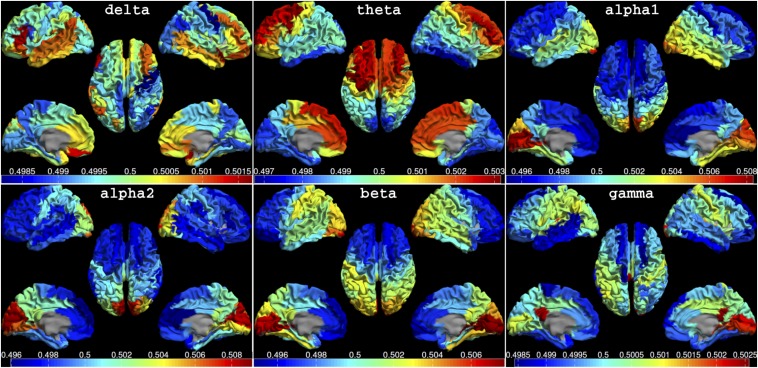
Fig. 1.
Mean dPTE for each ROI displayed as a color-coded map on the parcellated template brain, viewed from, in clockwise order, the left, top, right, right midline, and left midline. Note the smooth global patterns of preferential information flow in the higher-frequency bands (alpha1 to beta), consisting of posterior regions that are leading anterior regions. The opposite pattern was observed in the theta band. Hot and cold colors indicate information outflow and inflow, respectively. See Fig. S1A for the connectivity matrices.

