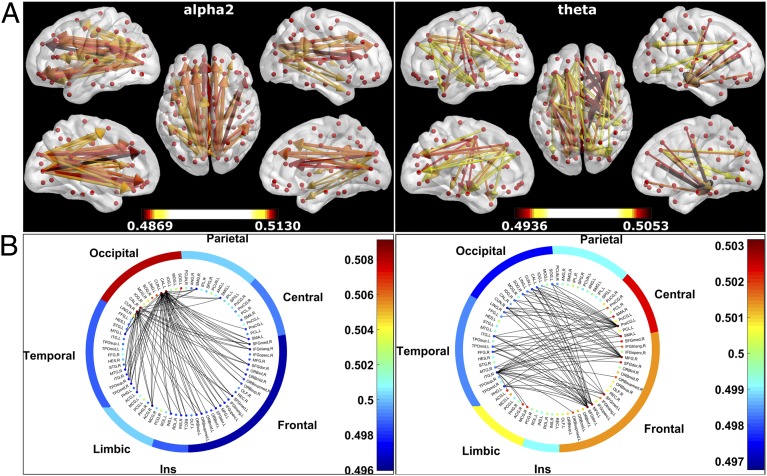
Fig. 2.
Preferred direction of information flow between regions. (A) Preferential information flow for the alpha2 and theta band displayed on the template brain using BrainNet Viewer (version 1.5), viewed from, in clockwise order, the left, top, right, right midline, and left midline. Colors and line thickness indicate the dPTE values (lower and upper thresholds: [0.4892, 0.5108] and [0.4955, 0.5045] for the alpha2 and theta bands, respectively), and arrows indicate the preferred direction of information flow. Thresholds were chosen to highlight the dominant patterns formed by the information streams between regions; for statistically thresholded images, we refer to Fig. S1B. (B) Preferential information flow for the alpha2 and theta bands displayed as circular plots (after ref. 22). The color of each node indicates the mean dPTE value for that ROI. The full names of the ROIs are given in Table S1. The nodes were grouped as frontal lobe, central regions, parietal lobe, occipital lobe, temporal lobe, limbic region, and Insula (Ins), with the color of each group indicating the mean dPTE value for the group. The interior shows the connections between nodes (threshold as in A). See also Tables S2−S5.

