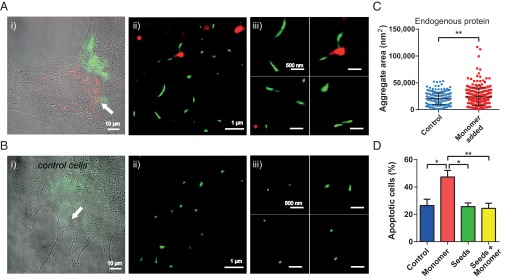
Fig. 4.
(A, i and B, i) Overlaid differential interference contrast and wide-field fluorescence images of VM cells immunostained for endogenous AS using a secondary Ab tagged with AF568 (green), either treated for 1 h with monomeric AS labeled with AF647 (red), followed by a 24-h incubation in AS-free medium (A), or untreated (B). (A, ii and B, ii) Zoomed-in dSTORM images in the areas indicated by white arrows. (A, iii and B, iii) Zoomed-in dSTORM images of aggregates of the endogenous AS species (green) in both treated (A) and control (B) cells. (Scale bars: 500 nm.) (C) Size distribution of endogenous AS species formed in control cells compared with cells treated with monomeric AS. The statistical analysis was performed using an unpaired t test (**P < 0.01). The experiment was repeated seven times, and 10 randomly chosen areas were imaged each time. (D) Percentage of apoptotic cells in control cells (blue), cells treated with monomer only (red), cells treated with seeds only (green), and cells treated consecutively with seeds and monomer (yellow). The statistical analysis was performed using repeated measures ANOVA: F(3,12) = 7.198 followed by a Tukey’s multiple comparison test (*P < 0.05; **P < 0.01). The experiment was repeated four times, and two samples per condition were analyzed each time.

