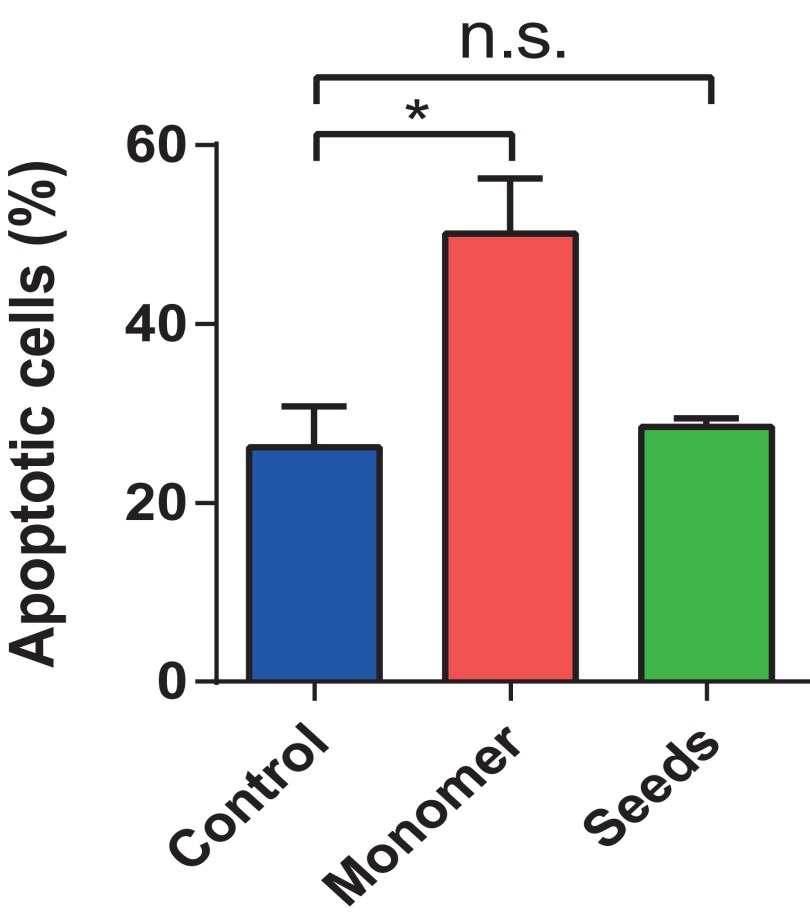
Fig. S7.
Percentage of apoptotic cells in control cells (blue), cells treated with monomer only (red) at a concentration of 500 nM, and cells treated with seeds only (green) at a concentration of 500 nM. The statistical analysis was performed using two-way ANOVA: F(2,3) = 17.36, followed by a Tukey’s multiple comparison test (*P < 0.05). The experiment was repeated four times. n.s., not significant.

