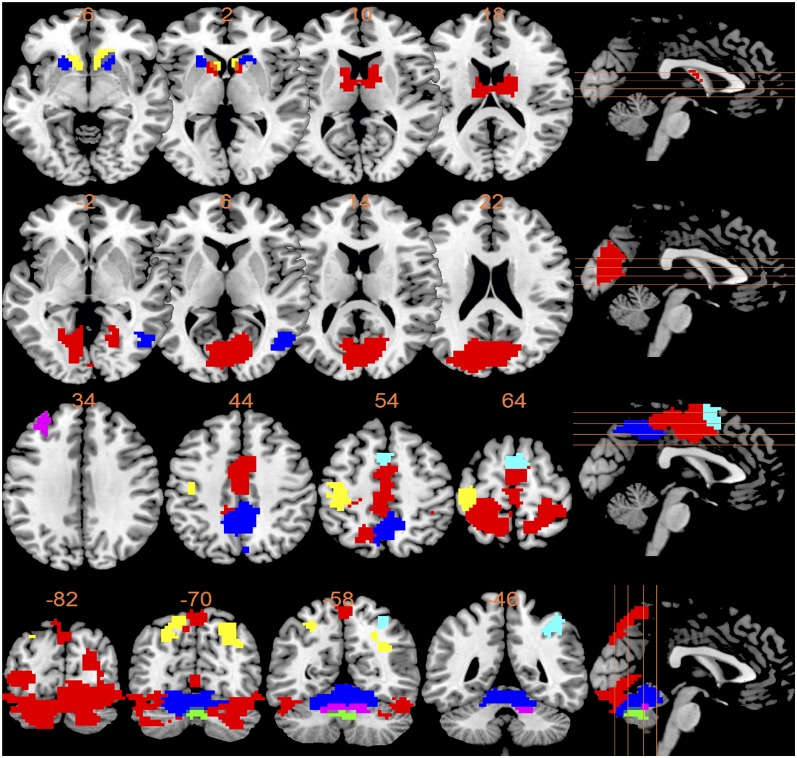
Fig. 1.
Illustration of fMRI clusters/nodes. (Row 1) Node 1: module 7, caudate (red); module 15, putamen (blue); and module 21, nucleus accumbens (yellow), with multisplicing axial view at Montreal Neurological Institute (MNI) coordinate z equal to −6, 2, 10, and 18. (Row 2) Node 2: module 3, visual area V1 and V2 (red) and module 19, the right parietal/temporal/occipital area (blue), with multisplicing axial view at MNI coordinate z equal to −2, 6, 14, and 22. (Row 3) Node 3: module 2, primary somatosensory and motor areas (red); module 6, anterior precuneus (blue); module 10, left precentral and postcentral gyrus (yellow); module 17, dorsorostral supplementary motor area (light blue); and module 29, left dorsolateral prefrontal cortex (purple), with multisplicing axial view at MNI coordinate z equal to 34, 44, 54, and 64. (Row 4) Node 4: module 1, visual area V3 and V4 (red); module 4, cerebellum anterior lobe and declive of posterior lobe (blue); module 5, superior parietal lobe (yellow); module 11, right supramarginal gyrus (light blue); module 16, arbor vitae (purple); and module 22, cerebellum vermis (green), with multisplicing sagittal view at MNI coordinate y equal to −82, −70, −58, and −46.

