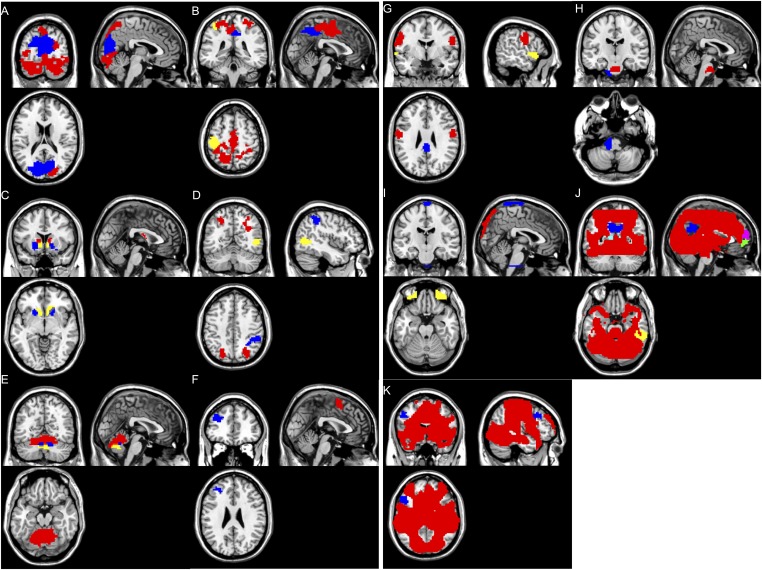
Fig. S1.
Top 30 modules from the WVCNA. (A) Occipital cortex regions. Red (module 1): Brodmann areas 18 and 19. Blue (module 3): Brodmann areas 17–19. (B) Sensory and motor cortex regions. Red (module 2): Brodmann areas 3–7. Blue (module 6): Brodmann area 7. Yellow (module 10): Brodmann areas 3 and 4. (C) Subcortical regions. Red (module 7): caudate. Blue (module 15): putamen. Yellow (module 21): nucleus accumbens. (D) Parietal cortex regions. Red (module 5): Brodmann area 7. (Right) Blue (module 11): Brodmann area 40. Yellow (module 19): Brodmann areas 37 and 39. (E) Cerebellum regions. Red (module 4): anterior lobe and declive of posterior lobe. Blue (module 16): arbor vitae. Yellow (module 22): tuber and declive vermis. (F) Frontal cortex regions. Red (module 17): Brodmann area 6. (Left) Blue (module 29): Brodmann area 9. (G) Ungrouped modules I. Red (module 9): Brodmann areas 4 and 6. Blue (module 23): Brodmann areas 23 and 31. (Left) Yellow (module 28): Brodmann areas 22 and 38. (H) Ungrouped modules II. Red (module 18): medial pons. Blue (module 26): left caudal pons. (I) Noise modules. Red (module 12), blue (module 13), and yellow (module 24). (J) Negative BOLD response modules I. Red (the whole-brain activation map): positive BOLD response. Blue (module 8), yellow (module 14), pink (module 20), light blue (module 25), and green (module 30). (K) Negative BOLD response modules II. Red (the whole-brian activation map): positive BOLD Response. Blue (module 27).

