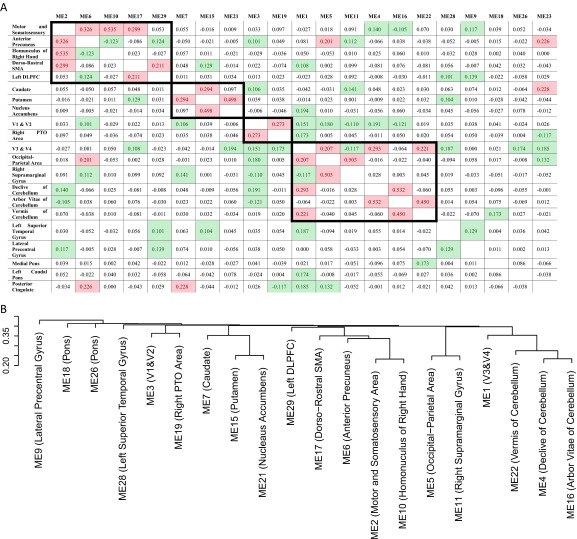
Fig. S2.
Hierarchical clustering analysis of functional connection matrix. (A) The functional connection matrix was calculated as pairwise partial correlations between all 21 valid modules, with all of the rest of the modules as control variables. For each module, the module names are listed in row 1, and the involved brain areas are listed in column 1. Cells with partial correlations that survived the Bonferroni correction for multiple testing are highlighted in green, and values over 0.20 are highlighted in red. Functional clusters/nodes established from hierarchical clustering as shown in B were grouped and highlighted with bold borders. (B) Tree of hierarchical clustering (in four clusters/nodes): node 1 (modules 7, 15, and 21), node 2 (modules 3 and 19), node 3 (modules 2, 6, 10, 17, and 29), and node 4 (modules 1, 4, 5, 11, 16, and 22). Module 23 (posterior cingulate cortex) was excluded from the tree because of its high correlation with multiple nodes. DLPFC, dorsal/lateral prefrontal cortex; ME, module eigenvoxel; PTO, parietal/temporal/occipital; SMA, supplementary motor area.

