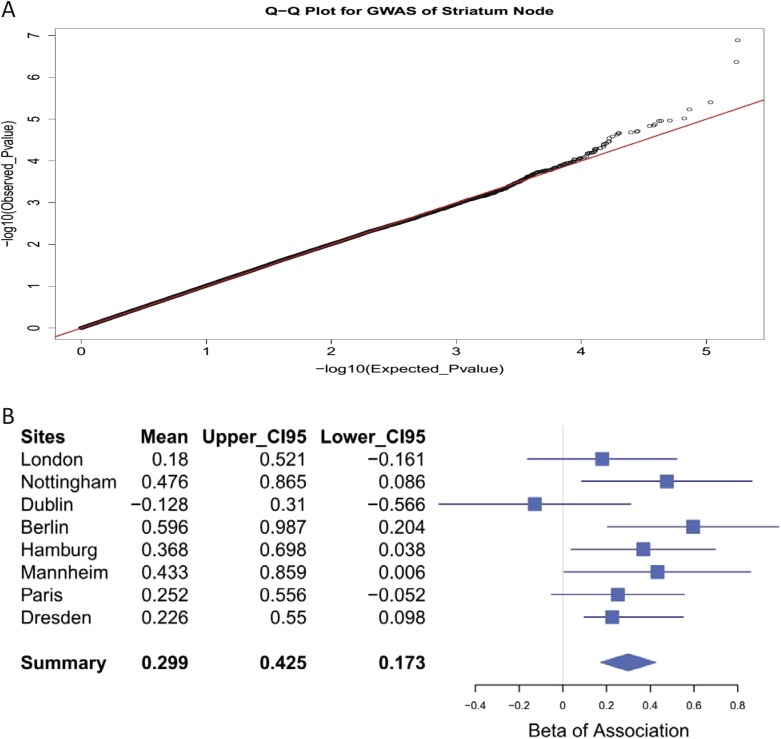
Fig. S4.
Assessing the reliability of the GWAS finding. (A) The quantile–quantile (Q–Q) plot shows an almost perfect match between the observed and expected P values, which indicates that the applied significance level is reliable. (B) The forest plots of associations between node 1 and SNP rs16958736 in each research site: the regression coefficients (i.e., β or mean) and the corresponding upper and lower 95% confidence intervals (CI95s) of the association between the activation in node 1 and SNP rs16958736 for research sites are listed in Left. In the forest plot in Right, the means or β-values of each research site are shown as blue cubes, and the ranges between upper and lower CI95s are shown as the blue lines. The integrated mean or β as well as its upper and lower CI95s were calculated from the metaanalysis by using the inversion of squared SEs as weight, and the result is illustrated as the blue diamond, where the mean is indicated vertically and the range between upper and lower CI95s is indicated by horizontally. The corresponding P value of the summarized result was 3.26 × 10⁻⁶.

