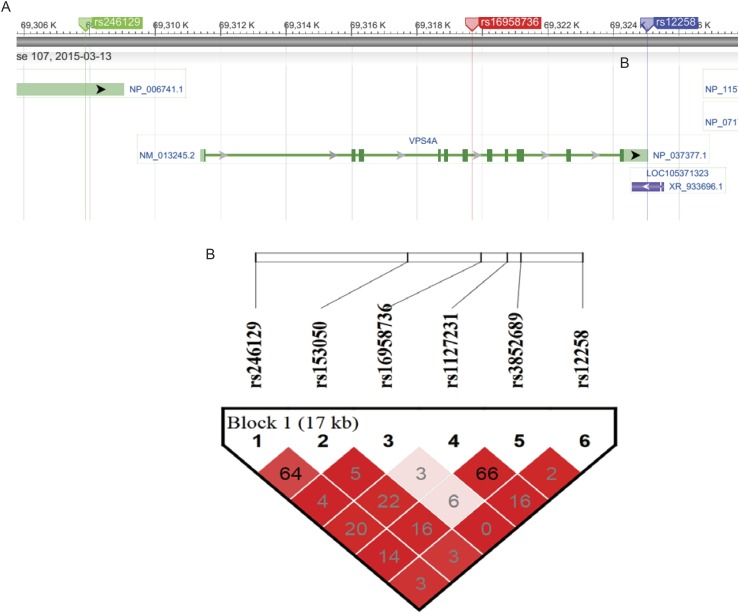
Fig. S5.
The structure and linkage disequilibrium (LD) plot of VPS4A genes. (A) The structure of the VPS4A gene was generated from the National Center for Biotechnology Information website (www.ncbi.nlm.nih.gov), where the first (rs246129) and last (rs12258) SNPs included in the following haplotype analyses are indicated in green and blue, respectively, and the main genetic finding rs16958736 is highlighted in red within the sixth intron of the VPS4A gene. (B) Haplotype blocks were generated through method solid spine of the LD. The whole VPS4A gene was involved in a single haplotype block. The white to red color scale measures the adjusted LD (D′) from low to high, whereas the number scale measures the squares of correlation coefficients (R2) between alleles from paired SNPs. The D′ is calculated as the LD divided by its theoretical maximum, and thus, D′ ranges between zero and one.

