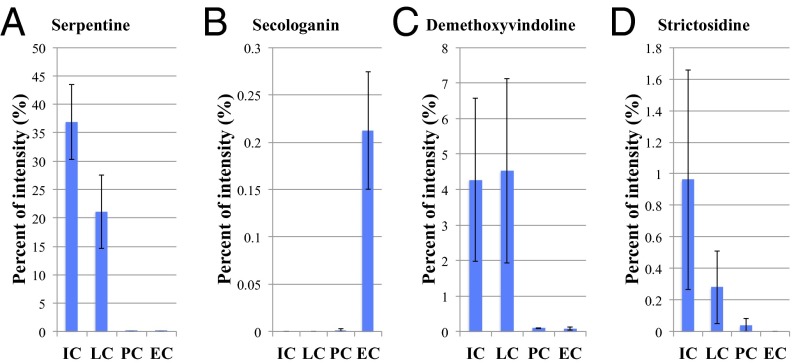
Fig. 4.
Semiquantitative analysis of TIAs calculated by Single-cell MS analysis data. (A) Serpentine was detected in IC and LC (m/z 349.15). (B) Secologanin was detected in EC (m/z 389.14). (C) Demethoxyvindoline was detected in all cell types (m/z 427.22). (D) Strictosidine was detected in IC and LC (m/z 531.23). The y axis shows percent of intensity normalized by the value of the total ion intensity of each sample. Values are the mean of three measurements (±SEM).

